Company Profile
 GLOBAL
 Request Info
Remote Graphic Panel RGP30 (with HDMI output)
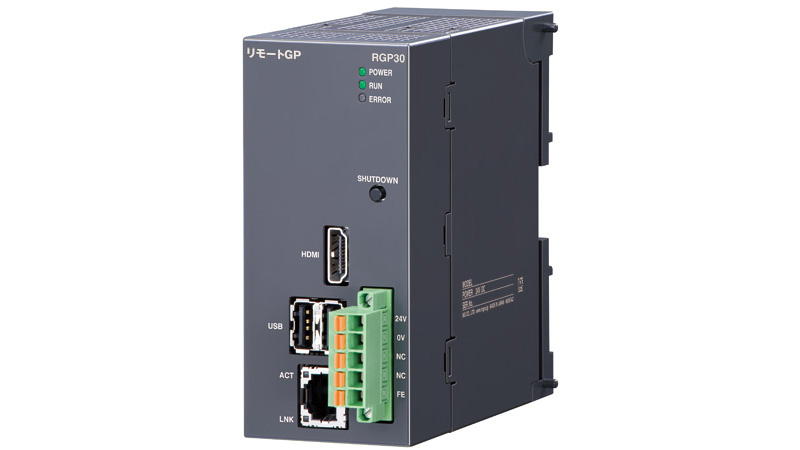
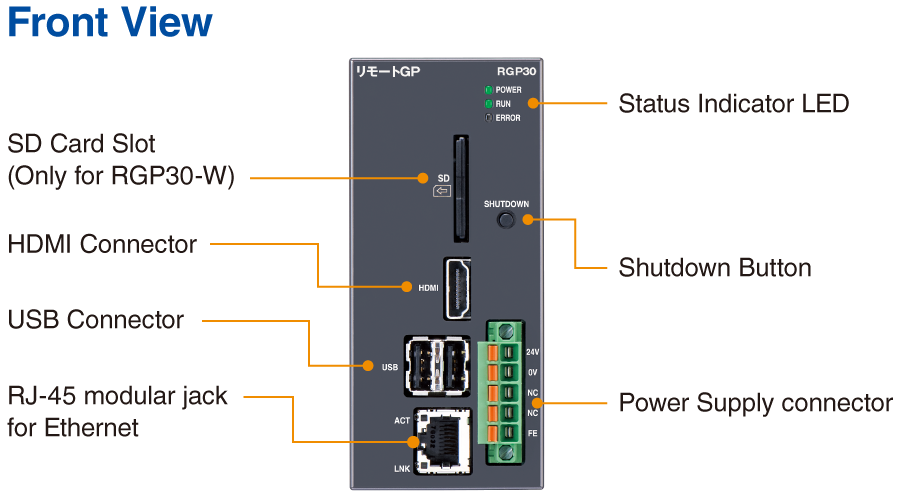
・Model: RGP30-W
Easy Visualization of Manufacturing Plant Operations
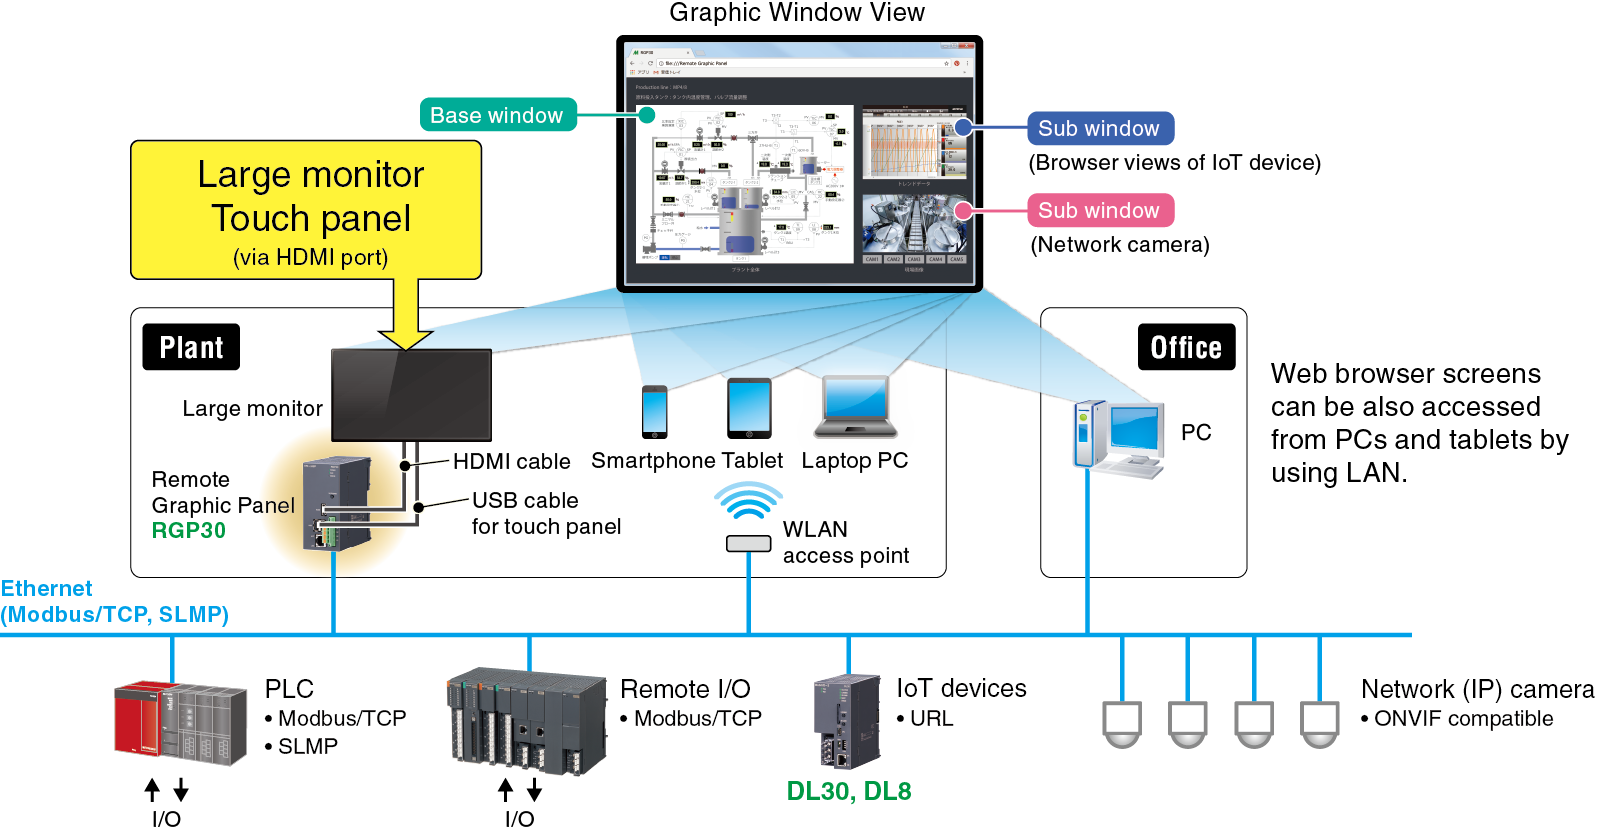
- Fulfills the function of display units using Web technology without dedicated displays.
- Supports Modbus/TCP and SLMP for connecting with various PLCs.
- Equipped with Web server which allows access via network and displays Web screen on browser of the user's terminal.
- Equipped with HDMI connector for connecting with an HDMI monitor.
- Facilitates creation of Graphic Panels with Designing Software (Model: RGP-Designer
 ).
).
Standard
Model: RGP30-N
For power (Standard with power monitor screen)
Model: RGP30-W
Commercially Available Large Displays with Cost Performance can be Connected through HDMI Port
The RGP30 is "a graphic panel without dedicated display" which enables users to freely choose a display device suitable for their applications.
It generates web browser screens showing various kind of data imported from PLCs, remote I/Os, IoT devices and CCTV cameras.
The dedicated graphic designing tool, RGP-Designer,*1 is used to build display panel designs with multiple inline windows and original graphics using graphical parts from the component library.
*1. Software is downloadable at Software Download&Upgrade.
*2. Please refer to the main energy monitoring specifications for details.
*3. Please refer to the data sheets of the RGP30 Remote Graphic Panel for details.
New model with power monitoring function
Introducing the new RGP30-W Remote Graphic Panel for power monitoring, an update to the RGP30—the very popular "display-free display" from MG Co., Ltd.—with specialized functions for displaying electric energy.
Discover the clear, simple monitoring windows made possible with this new product.
Simple, easy-to-understand energy monitoring windows (Model: RGP30-W)
Data can be displayed by day, month, or year.
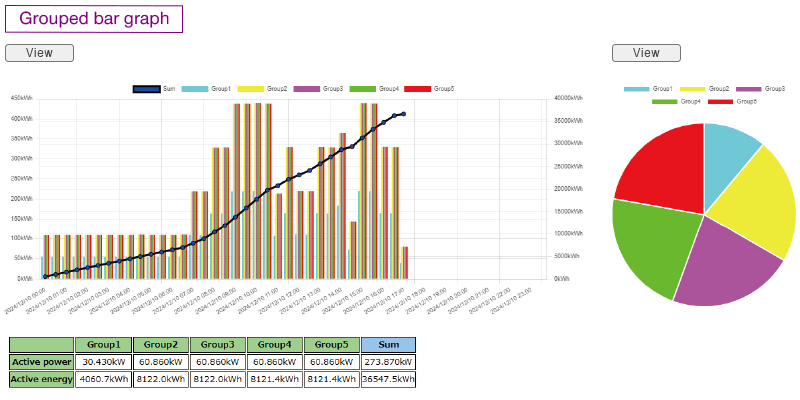
Energy window (daily data example)
Energies are color-coded by section and displayed in a bar graph and pie chart.
Bar graph data can be displayed as stacks with sections arranged vertically, or individually with sections arranged horizontally.
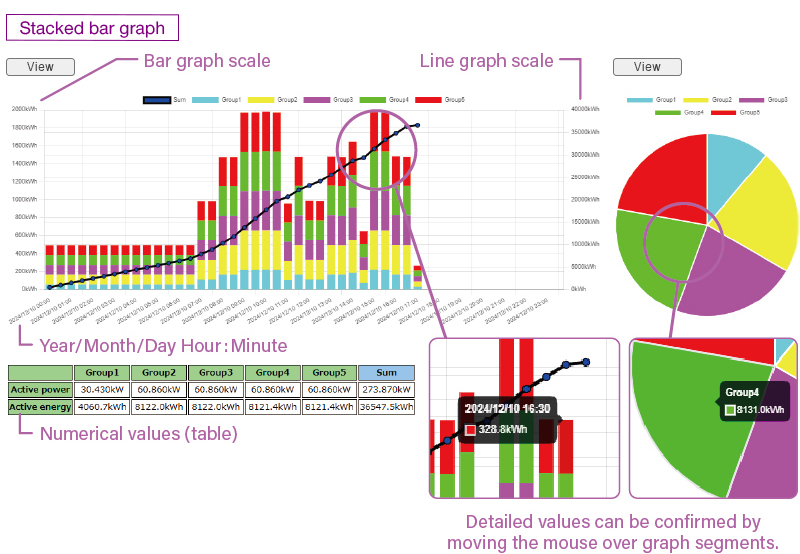
| Bar graph | : | Displays the active AC power per section per hour with groups separated by color. |
|---|---|---|
| Line graph | : | Displays the daily active AC power per hour. |
| Pie chart | : | Displays the daily active AC power ratio per section. |
| Numerical value (table) | : | Lists the active AC power (kW) for the listed time the daily active AC power (kWh) per section numerically. |
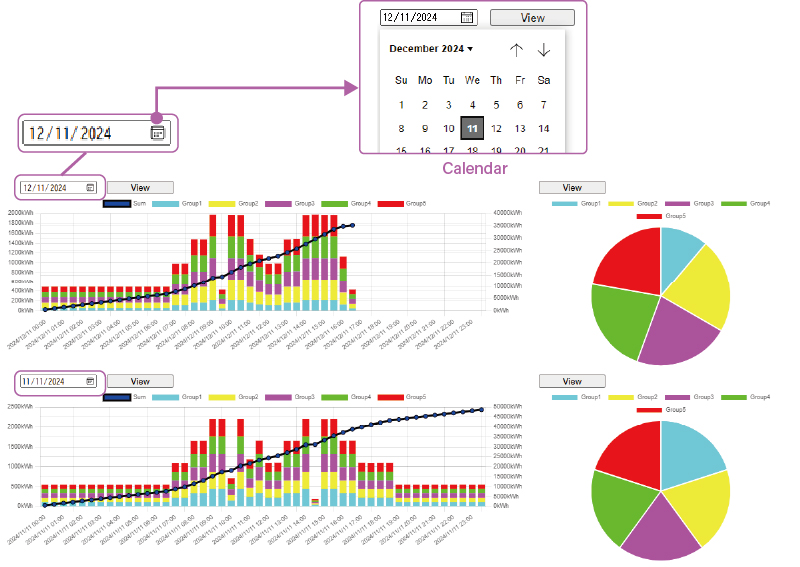
Comparison window (daily, example)
This window shows the energies for two days displayed vertically for any selected calendar day.
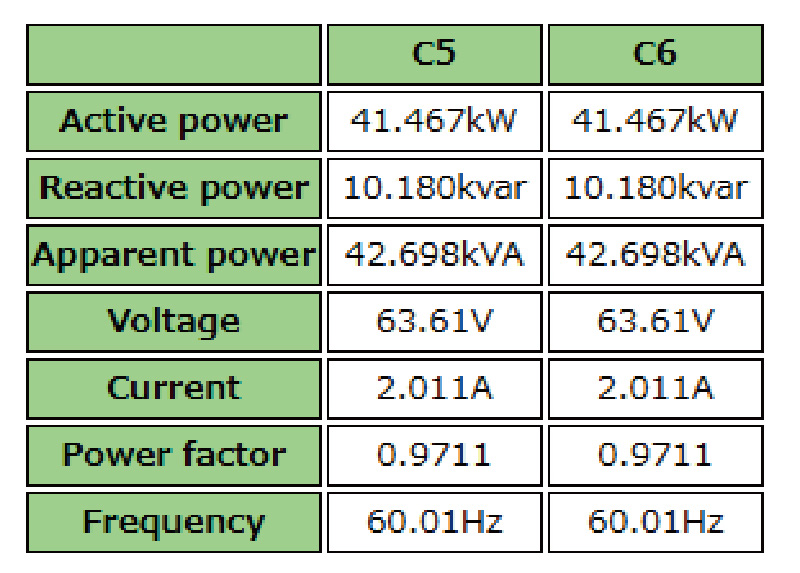
Section window
The section window displays the real-time active power, reactive power, apparent power, voltage, current, power factor, and frequency for each circuit belonging to the relevant section. Specific circuits can also be selected for display on the circuit window.
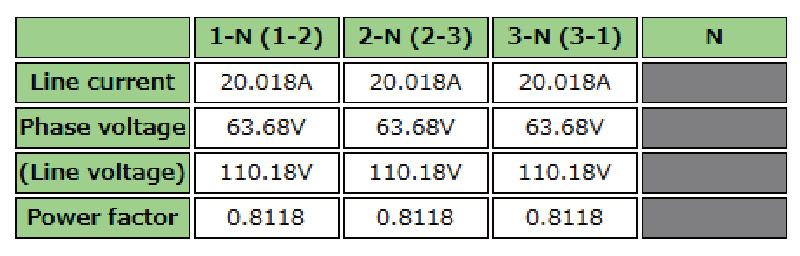
Circuit window
The circuit window displays the real-time voltage, current, and power factor between phases/lines of the relevant circuit. The real-time harmonic distortion content of selected elements can also be displayed as a bar graph.
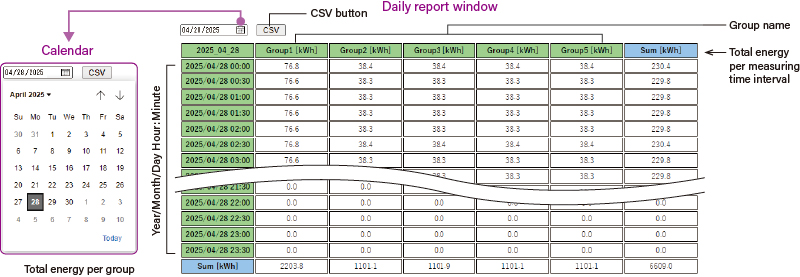
Report function for saving daily, monthly, and yearly reports to an SD card and downloaded
Report window (daily, example)
- Daily reports as well as monthly and yearly reports can be created.
- Energy data can be listed according to section.
- Report data can be saved as a CSV file to an SD card.
- Days to be displayed can be easily selected from the calendar dialog.
- Data from the currently viewed daily report can be saved as a CSV file using the browser’s download function.
External View