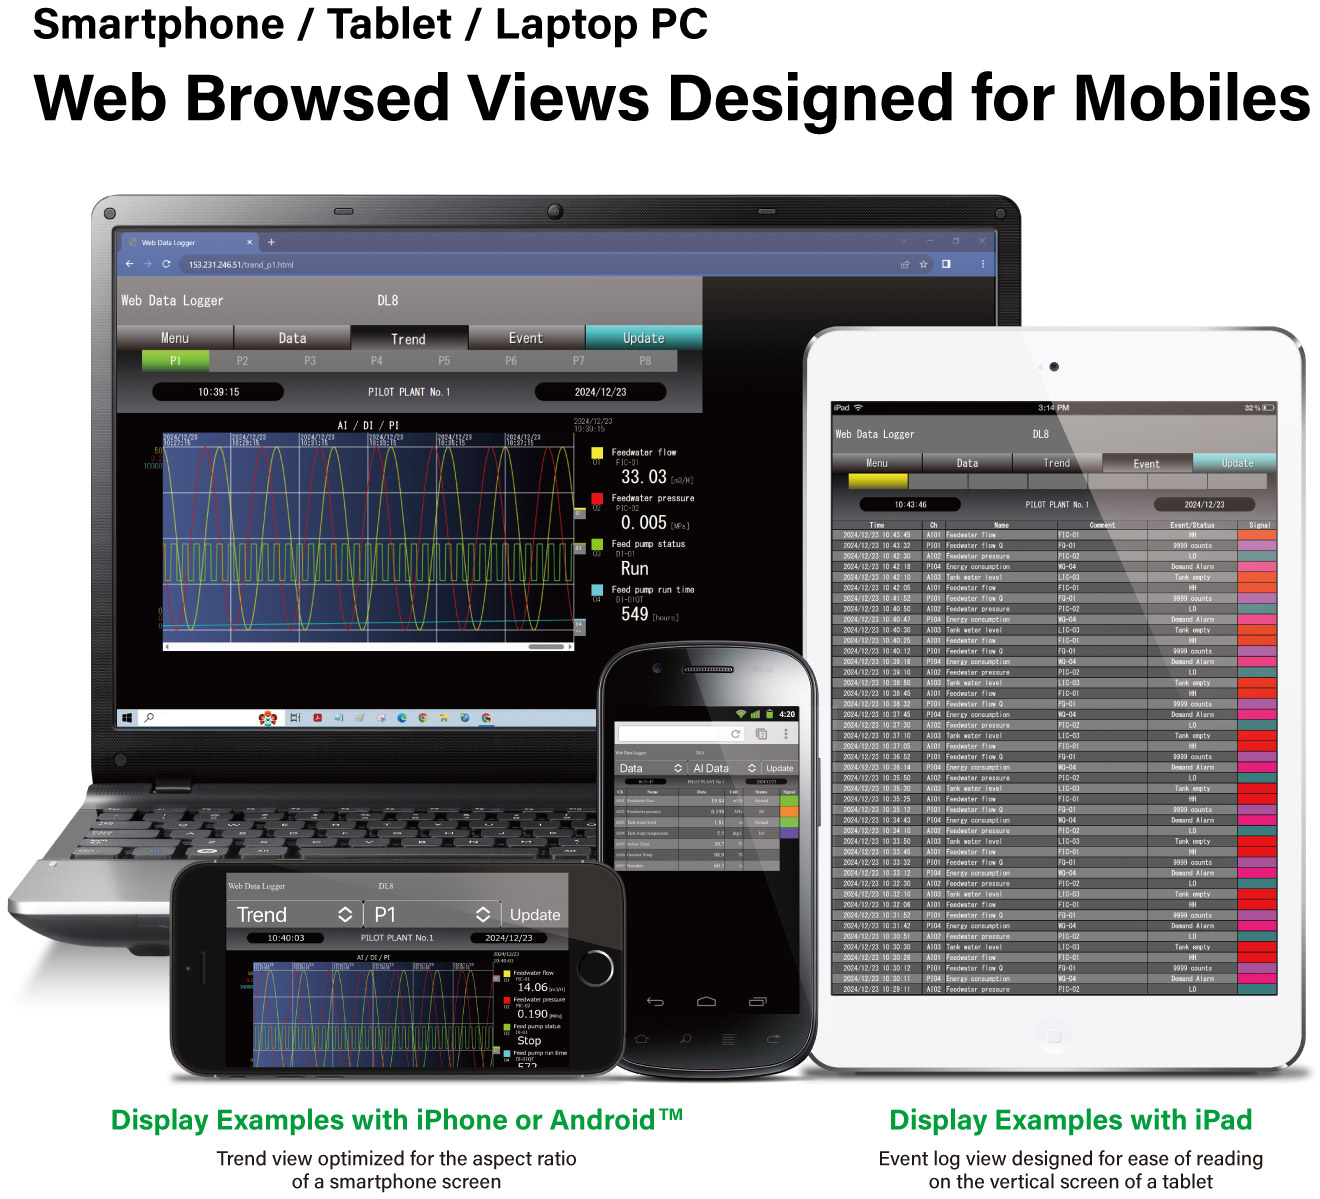
Web Browser Views
· iPhone and iPad are registered trademarks of Apple Inc.
· Android and Android logo are trademarks of Google Inc.
· The screen is an image only.
· Mobile terminals (smartphones, tablets) or mobile network operator services are not our products.
PC Screen
Smart Phone Screen
Short trend and digital data displays are available to monitor analog, discrete and totalized pulse signals. Event log is also available to review alarm events. All the views can be quickly ready for use by simple setting.
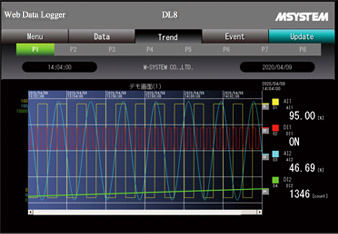
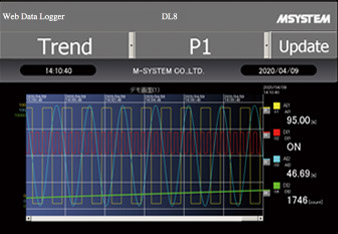
Trend
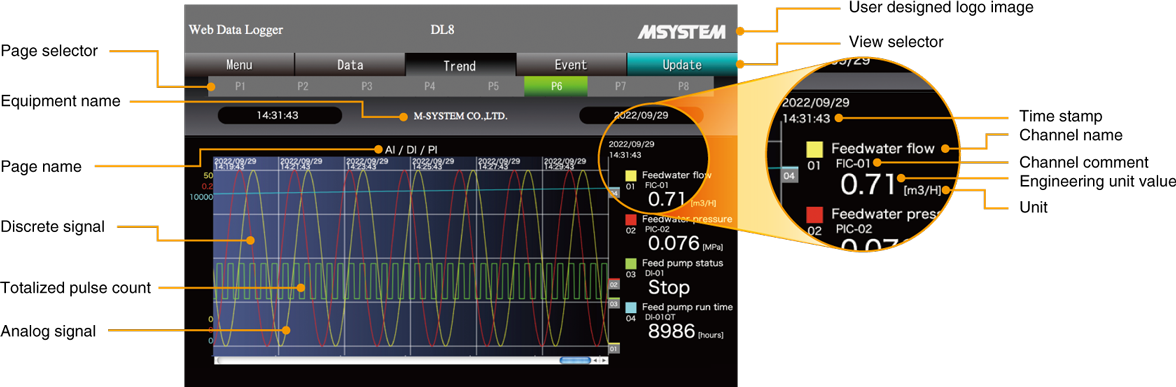
Trend View Specifications
| Sampling rate | 1 s / 5 s / 10 s / 30 s / 1 min / 5 min / 10 min / 30 min / 1 h / 1 day |
|---|---|
| Number of pages | 8 pages |
| Number of chs | 4 chs per page |
| Pen color | User defined (RGB) |
| Graph range | User defined (engineering unit value) |
| Number of samples | Max. 7200 points per ch |
| Scrollable charts | 1 to 10 (720 samples @chart span) |
Event Log
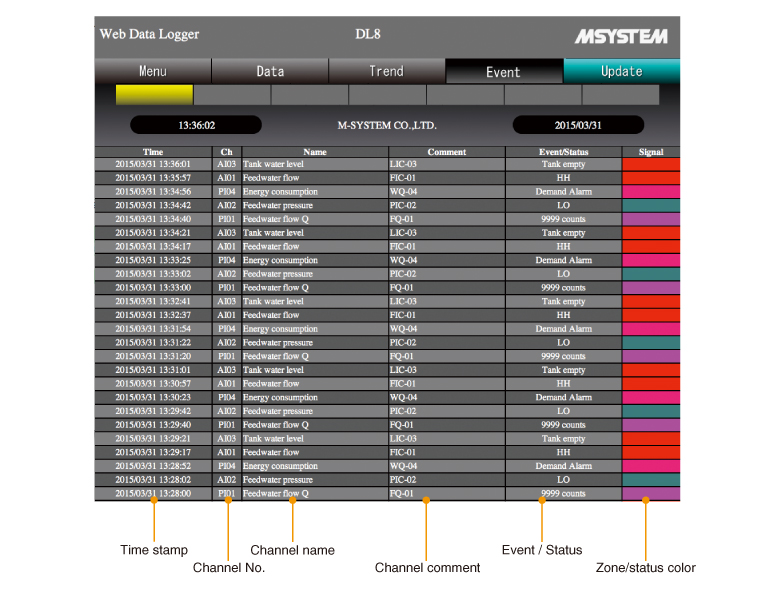
Event Log Specifications
| Analog signal | Alarm triggered when measured value passes across the setpoint. |
|---|---|
| Discrete signal | Alarm triggered when status changes. |
| Totalized count | Alarm triggered when pulse count exceeds the setpoint. (Counter can be reset.) |
| Pulse signal | Alarm triggered when measured value passes across the setpoint. |
E-mails can be sent when an event occurs.
Specific recipients and texts can be defined for each event condition.
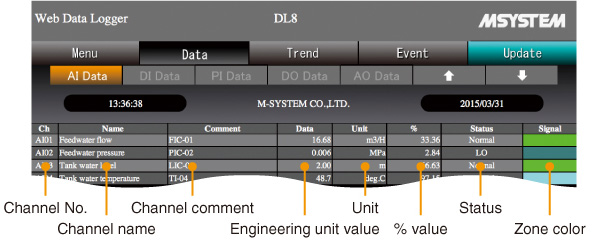
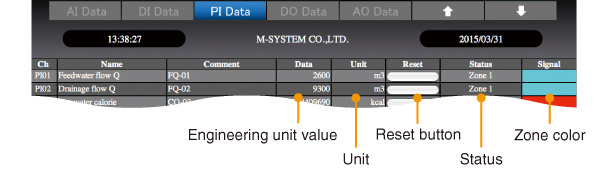
Data
-
Analog Input Data Display
-
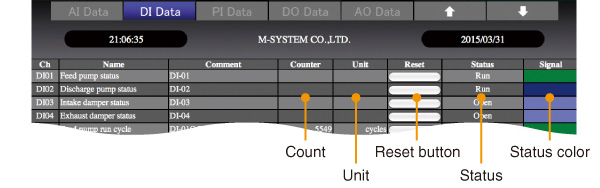
Discrete Input Data Display
-
Pulse Input Data Display
-
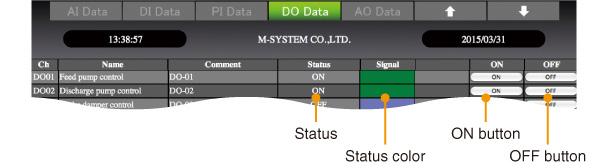
Discrete Output Data Display
-
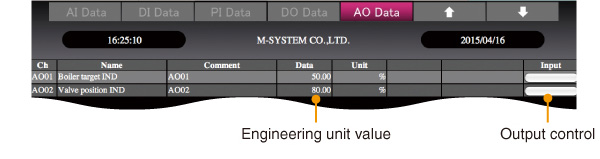
Analog Output Data Display
Customized Web Browser Views (DL8-D,E Option)
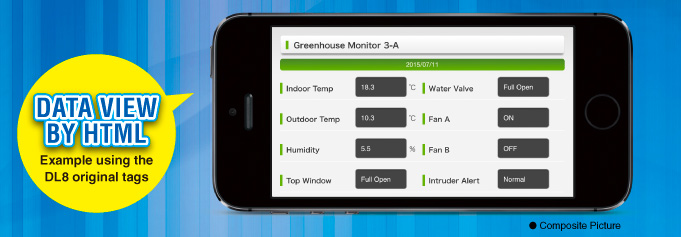
Using the DL8 Original Tags
The DL8 original tags in an HTML file are automatically converted into corresponding text/data string by the DL8.
Users who do not have technical knowledge of programming scripts can easily create an original data view.
The DL8 User Defined View must be created and used under the user’s sole responsibility, including its Display components and functions.
| Original Tag | Contents | Converted Text/Data String (example) |
|---|---|---|
| [NAME1] | Name 1 | Web Data Logger |
| [NAME2] | Name 2 | Web Data Logger |
| [NAME3] | Name 3 | Web Data Logger |
| [TIME1] | Present Time | 2012/02/29 11:00:00 |
| [TIME2] | Not Used | ---- |
| [AI1_NAME] | Ai1 | CH name |
| [AI1_COMM] | Ai1 | CH comment |
| [AI1_DATA] | Ai1 | Engineering unit data |
| [AI1_DATA_P] | Ai1 | % data |
| [AI1_UNIT] | Ai1 | Engineering unit |
| [AI1_AREA] | Ai1 | Zone name |
| [DI1_NAME] · · · [DO1_DATA] |
Di1 · · · Do1 |
CH name · · · Status (display comment) |
| [AO1_NAME] | Ao1 | CH name |
| [AO1_COMM] | Ao1 | CH comment |
| [AO1_DATA] | Ao1 | Engineering unit data |
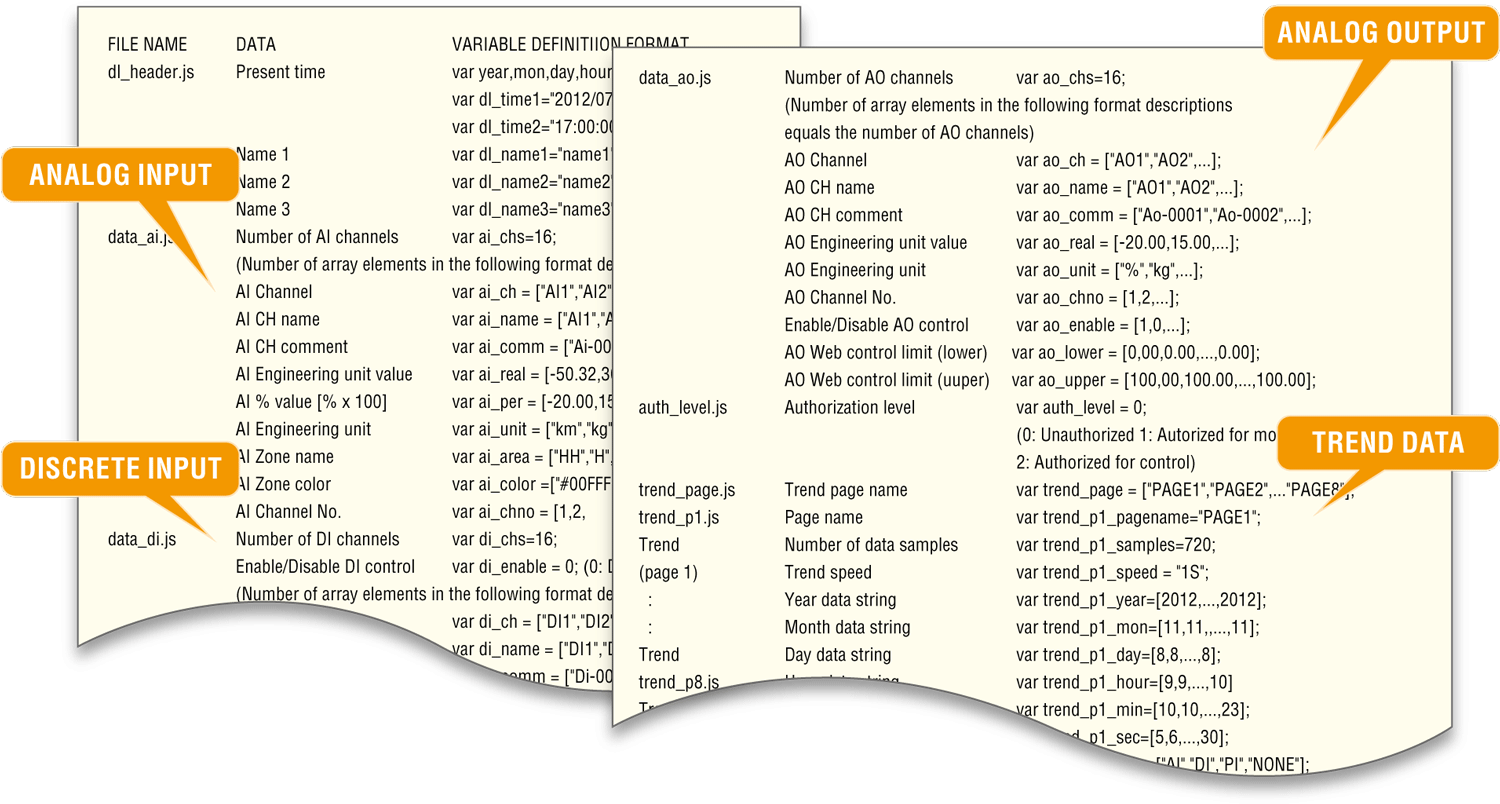
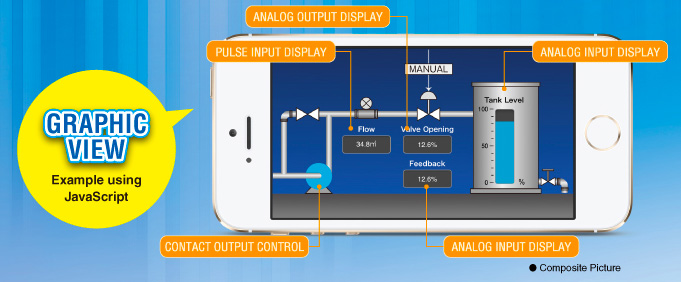
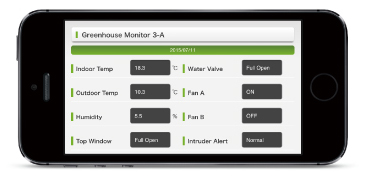
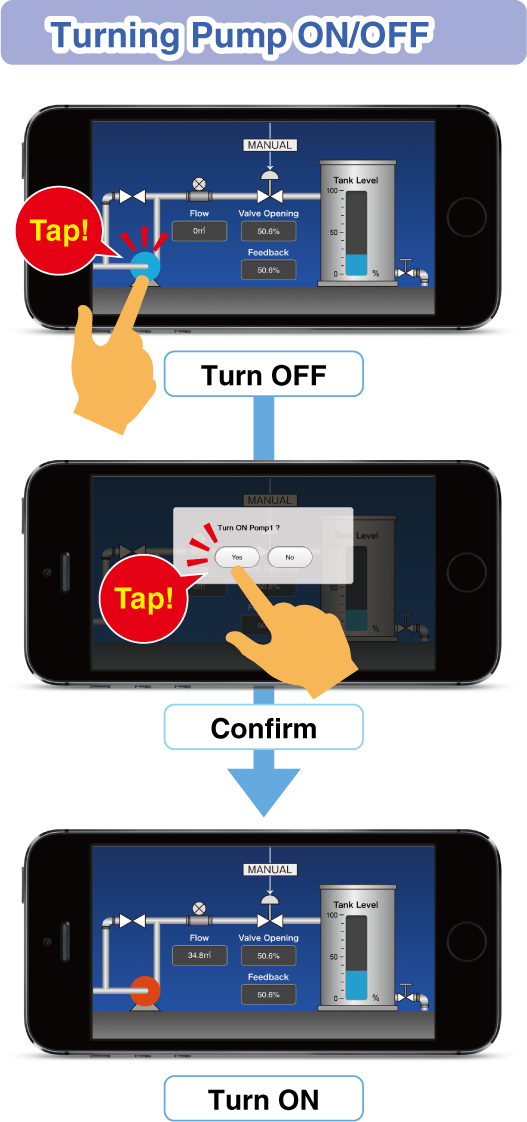
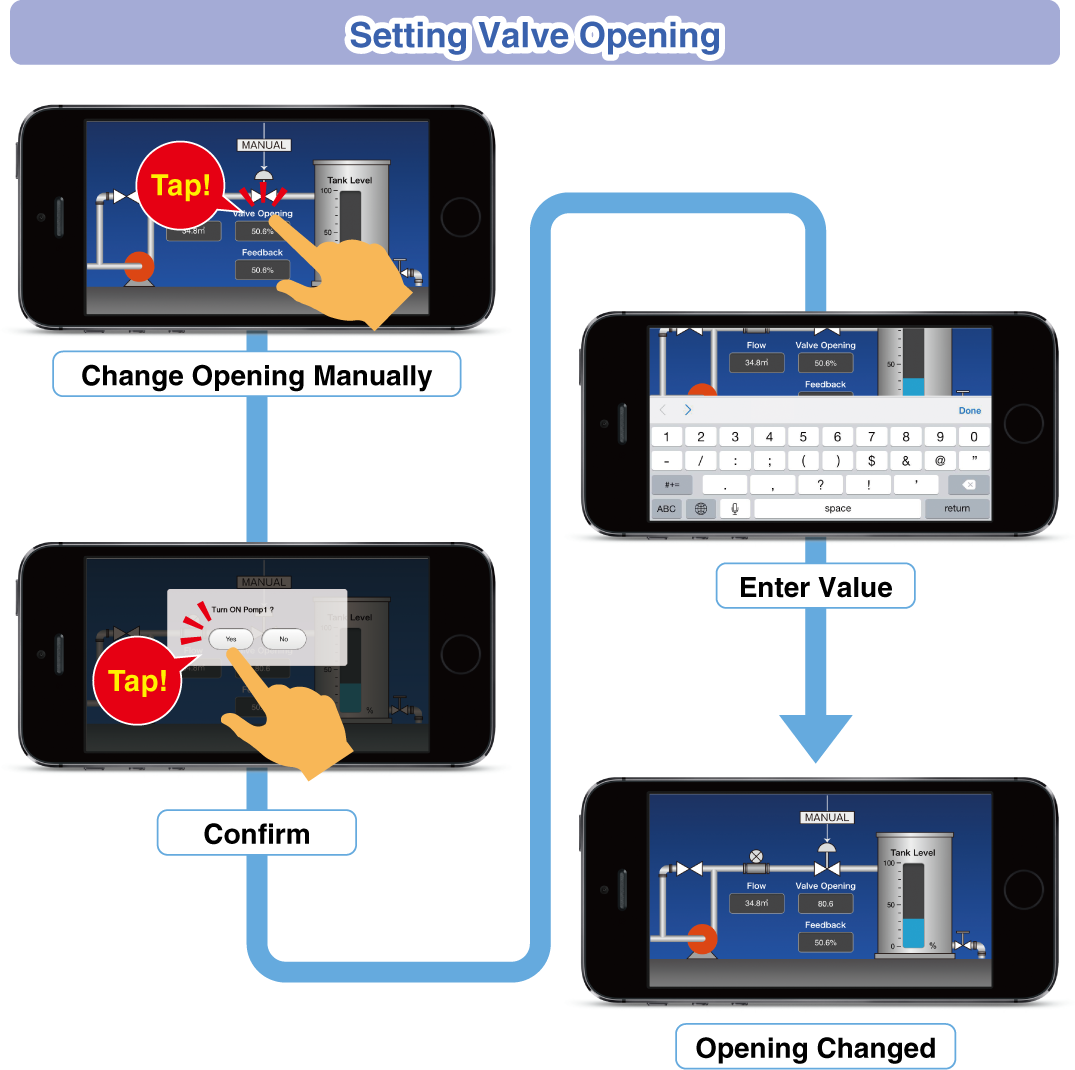
Creating User's Original Views by JavaScript or HTML
Measured data strings can be output as JavaScript arrays. Users who have knowledge and skills of JavaScript language, HTML and CSS used to build a web site can freely create original trend graphs, bargraphs and graphic views. Analog input, analog output, discrete input, discrete output, trend data, event data and other variety of array files are available.
· Simulated Imagery. View samples are not provided by us.
JavaScript Array Files